
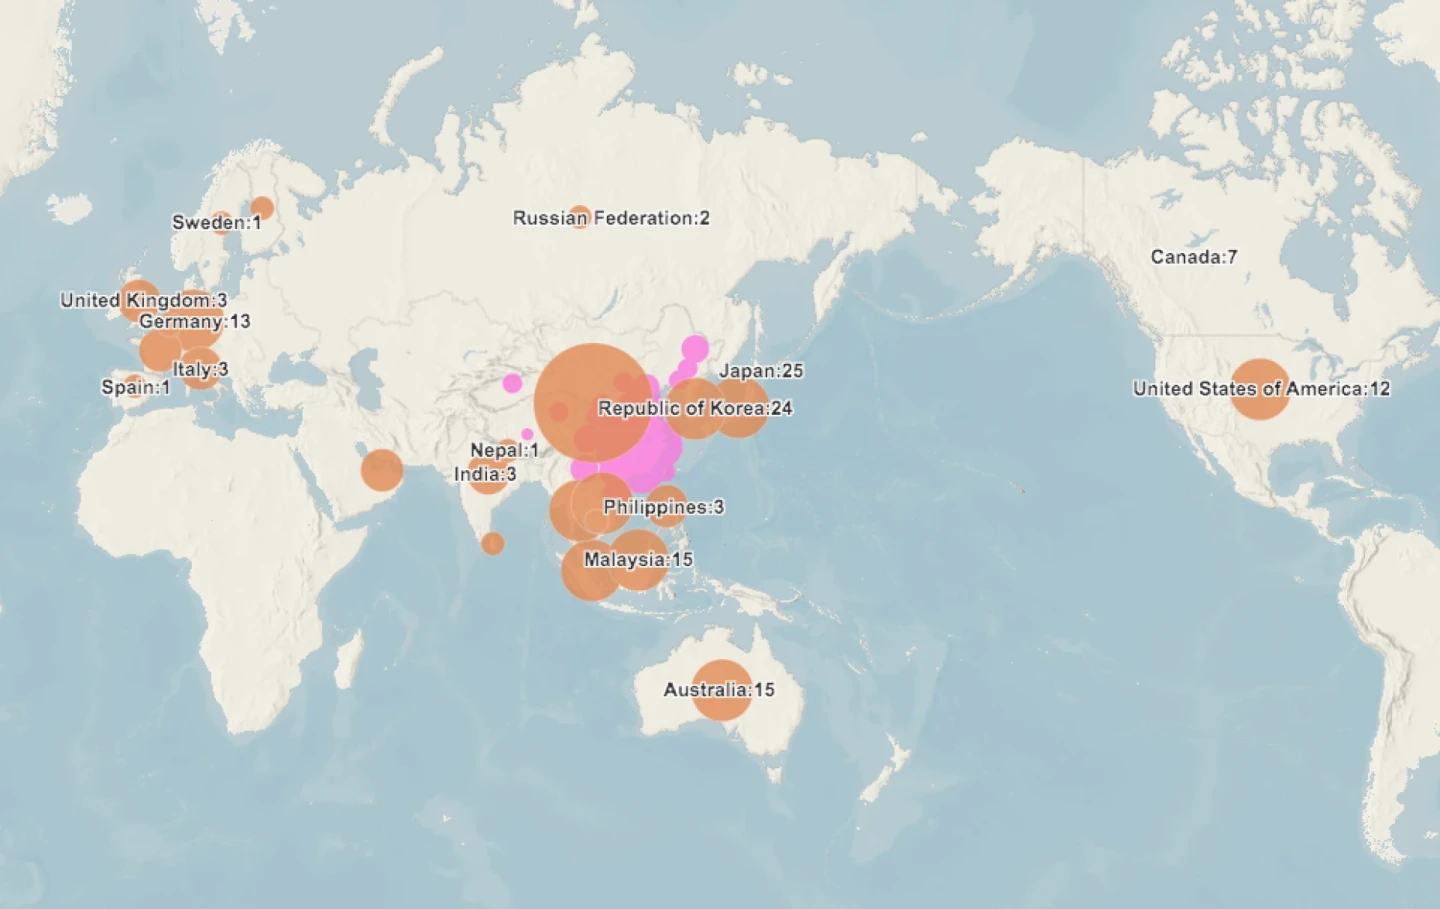
Live mapping: World Health Organization
Based on emerging geographic information systems techniques and tools, the World Health Organization and GIS professionals created a dynamic map of emerging coronavirus cases and fatalities that updates in real-time. View the interactive map below:
What is a Coronavirus?
If you’ve been keeping track of the news and wondered, “what is a coronavirus?”, you’re not alone. Coronaviruses are a family of viruses that cause respiratory illnesses. These can range from your average cold to more serious diseases such as Middle East Respiratory Syndrome (MERS) and Severe Acute Respiratory Syndrome (SARS).1 Novel coronaviruses (CoV) are new strains that have not previously been identified in humans.1 The most recent novel coronavirus, which has been named 2019-nCoV, originated in Wuhan, China and was reported to the World Health Organization (WHO) on December 31, 2019.1 According to WHO, as of February 7, 2020, there have been more than 31,000 confirmed cases in more than two dozen countries. There have been at least 638 deaths related to 2019-nCoV worldwide.2
The first reported infected individuals were stallholders from the Wuhan South China Seafood Market, which was closed on January 1 for decontamination. Genome sequencing of 2019-nCoV has shown that it is related to MERS and SARS, but the mortality and transmissibility of the new coronavirus remain unknown.3
Forecasting Coronavirus Transmission
Predicting the spread of disease and mapping out epidemics is garnering vital attention in the medical field. There is increased awareness that a number of forces, such as the ability to travel across the world in under 24 hours, high population density in many regions, and increased contact between humans and animals, all make human populations vulnerable to epidemics. In fact, epidemiologists caution that events such as the transmission of MERS, SARS and 2019-nCoV likely are not isolated incidents, but part of a growing trend.
In the near future, we could potentially help mitigate the impact of new viruses by using contemporary techniques that integrate healthcare tools with forecasting capabilities which utilize an array of modeling and machine learning methods. This most recent pandemic of the coronavirus has shown us that we can’t yet prevent outbreaks, but we can increase our understanding of where they’re likely to occur. With this said, let’s examine the most recent coronavirus transmission and explore how the outbreak became widespread.

The Creation of a Pandemic
To start, we must put the growing population density into perspective: Today, China has roughly four times as many train and air passengers than it did during the SARS outbreak in 2003.4
Wuhan City, Hubei Province, is the country’s seventh-largest city with 11 million residents. This city is a major air transportation hub in central China; on an average day 3,500 passengers take direct flights from Wuhan to other cities and countries.4 While it’s not surprising that these connecting countries were the first outside of China to report cases of the new coronavirus, this type of travel poses a significant risk for outbreaks in nations with healthcare systems that are not equipped to handle them.
Wuhan is also a vital transportation hub within China. High-speed trains and domestic airlines link this city to Beijing, Shanghai and other major cities. Between October and November of last year, nearly 2 million people traveled from Wuhan to other destinations within China.4

The most pressing concern for Chinese health officials was the risk of further transmission as a result of high travel volumes and large gatherings to celebrate the Lunar New Year (Chinese New Year) on January 24. On January 23, Wuhan halted all public transport and air travel in and out of the city. By January 24, tens of millions of citizens living in Wuhan and surrounding municipalities were under quarantine. Many other cities canceled Lunar New Year celebrations as an extra procaution.3 However, Wuhan’s mayor admitted that, before the travel ban and quarantine began, 5 million people had left the city for such celebrations
Globally, many countries are temporarily refusing entrance to noncitizens who recently traveled to China, and many major airlines have suspended direct service to mainland China for the coming months. Bordering countries have reduced travel and visas for the time being to prevent the coronavirus from spreading.4 In the U.S., federal health officials have quarantined all 195 American citizens who were evacuated from Wuhan. Officials have also instituted airport screenings in 20 different cities and isolated sick patients.4
Efforts to Map Coronavirus Transmission
In response to this developing public health crisis, a coalition of public health officials and geographic information systems (GIS) professionals have banded together to create a GIS Dashboard using ArcGIS Online.5 This dashboard gathers relevant data from health organizations such as WHO, the U.S. Center for Disease Control and Prevention (CDC), China CDC, European CDC, as well as NHC and DXY. (DXY is a Chinese website that collects NHC and local China CDC situation reports in near real-time.)6
With the improvement of computational methods and mapping techniques, GIS professionals have been able to provide more accurate spatial forecasts and even predictions as to how epidemics may spread. These methods and techniques have led professionals to believe that the actual number of coronavirus cases in mainland China was much higher than was initially reported.7 It also enabled them to pinpoint the cities outside of mainland China that were at greatest risk of an outbreak. By collecting the final destination of travelers across all airports in a country or region, their model was able to predict the expected number of foreign cases arriving at each airport around the world.

A great deal of uncertainty still surrounds this disease. Many vital facts are still missing, such as rates of new coronavirus transmission, its incubation period, the spread of infection between asymptomatic individuals and the length of the recovery period. These factors make it difficult to know exactly when an outbreak could occur. But these new mapping methods combined with statistical tools such as ProMED and HealthMap can potentially provide an advanced warning to healthcare professionals to prepare for a possible outbreak in their area.8
With the current range of this new coronavirus and the speed and scope of international travel, the number of cases and deaths will probably continue to rise steadily in the short term. If you feel called to utilize GIS technology to solve our world’s most urgent issues, consider how an online Master of Geographic Information Science (GISc) from Kent State University could help you save lives in your community and the world.
If you want to learn to master this technology faster, without the time investment of a full degree, you can also choose from three postbaccalaureate certificates in geographic information science disciplines.
Sources:
- Retrieved on February 7, 2020, from who.int/news-room/q-a-detail/q-a-coronaviruses
- Retrieved on February 7, 2020, from gisanddata.maps.arcgis.com/apps/opsdashboard/index.html#/bda7594740fd40299423467b48e9ecf6
- Retrieved on February 7, 2020, from systems.jhu.edu/research/public-health/ncov/
- Retrieved on February 7, 2020, from nytimes.com/interactive/2020/world/asia/china-coronavirus-contain.html
- Retrieved on February 7, 2020 from who.maps.arcgis.com/apps/opsdashboard/index.html#/c88e37cfc43b4ed3baf977d77e4a0667
- Retrieved on February 7, 2020, from geographyrealm.com/mapping-the-spread-of-the-wuhan-coronavirus/
- Retrieved on February 7, 2020, from systems.jhu.edu/research/public-health/ncov-model-2/
- Retrieved on February 7, 2020, from gislounge.com/mapping-epidemics/


