
Understanding how long the average person lives is a foundational metric for evaluating community well-being and healthcare system effectiveness. By tracking life expectancy in the U.S., public health professionals can identify critical areas for intervention and monitor the impact of widespread medical advancements. This blog will cover current statistics, historical trends and demographic differences in life expectancy in the United States.
Key Takeaways
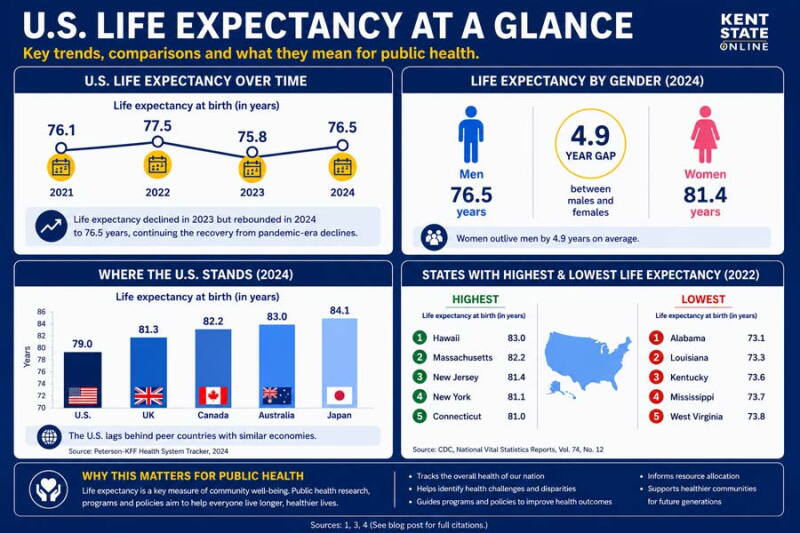
- The U.S. average life expectancy at birth reached 79.0 years in 2024, reflecting a continued rebound from recent pandemic-era declines1
- Public health experts calculate national estimates using period life tables, which project outcomes based on current mortality patterns2
- The nation's longevity remains lower than many peer countries due to chronic disease burdens and barriers to healthcare access3
- Women continue to outlive men in the United States by a margin of nearly five years1
What Is the Life Expectancy in the U.S. Today?
The most recent data from the Centers for Disease Control and Prevention (CDC) provides a clear answer regarding current U.S. life expectancy. In 2024, the life expectancy at birth for the total U.S. population was 79.0 years.¹ This represents an increase of about 0.6 years from 2023.¹
To determine this figure, public health experts rely on period life tables.² These tools provide a standard statistical snapshot, estimating how many more years individuals at a given age can expect to live assuming that the mortality rates observed in that specific year persist over the rest of their lives — rather than serving as a forecast of future conditions.²
The recent upward shift in these statistics is largely driven by a 3.8% decrease in the age-adjusted death rate.¹ Improved longevity outcomes are tied to fewer deaths from unintentional injuries, COVID-19, heart disease and cancer.¹
Analyzing the U.S. Life Expectancy Over Time
When examining the U.S. life expectancy over time, the long-term historical trend reveals dramatic growth throughout the 20th century. However, recent decades have seen more turbulence. Following a period of stagnation in the 2010s, the nation experienced a sharp decline between 2019 and 2021.⁴ The U.S. life expectancy trend has recently stabilized, climbing from 77.5 years in 2022 to 78.4 in 2023⁴ and reaching 79.0 in 2024.¹
Despite this recovery, the U.S. continues to experience slower growth and a higher premature death rate compared to peer countries.³ Historically, breakthroughs in medicine and sanitation pushed longevity upward, but modern societal challenges now create significant headwinds that slow down progress.
Public Health Factors Influencing the U.S. Life Expectancy Trend
Numerous social and systemic factors shape how long people live. According to research from the Peterson-KFF Health System Tracker, approximately 32% of the premature death difference (deaths before age 75) between the U.S. and peer nations stems from cardiovascular, chronic respiratory and chronic kidney diseases.⁵ In addition, substance use and violence account for a substantial portion of the mortality gap.⁵
Public health professionals actively work to improve life expectancy outcomes by focusing on community-level interventions. Addressing social determinants of health is critical, as barriers to healthcare access often prevent the proper diagnosis and management of chronic conditions.⁶ Research suggests that prioritizing cultural competence in healthcare and addressing health disparities in diverse populations may help support improved access, patient trust and quality of care — factors that can contribute to narrowing mortality gaps across different demographic groups.
Breaking Down Life Expectancy in the U.S. by Gender
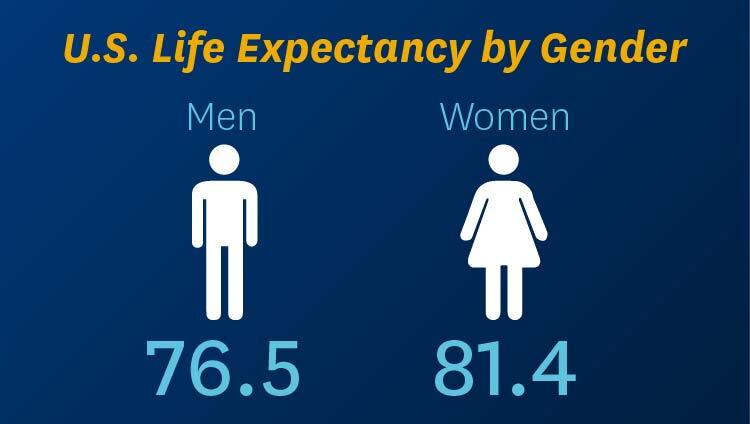
The life expectancy in the U.S. by gender reveals a distinct and persistent divide. In 2024, life expectancy at birth was 81.4 years for females and 76.5 years for males.¹ This 4.9-year gap highlights differences in mortality risks between males and females.
Historically, this gap widened heavily during the mid-20th century due to behavioral factors such as the early, widespread adoption of cigarette smoking among men.⁴ Today, biological and social elements both play a role. Males generally face a higher vulnerability to cardiovascular disease and are more likely to experience fatal conditions such as heart attacks and strokes earlier in life.⁷
Behavioral patterns also contribute to the divide. Males are statistically more likely to engage in dangerous activities and less likely to seek preventative medical care.⁷ Furthermore, recent data indicates that drug-related mortality and deaths of despair have driven much of the growth in the gender gap over the past decade.⁸
Shape the Future of Community Health With Kent State University
Understanding mortality trends emphasizes the ongoing need for dedicated public health intervention. Kent State University holds the esteemed distinction of being one of only seven institutions in Ohio to be recognized as an R1 top-tier research university by the Carnegie Classification of Institutions of Higher Education. Our programs aim to prepare students to lead transformative community initiatives that promote longer, healthier lives.
Whether you are seeking a Bachelor of Science in Public Health or a Master of Public Health, our curriculum is designed to equip you with the practical skills needed to tackle complex health challenges. Our programs feature rigorous coursework and robust applied practical experience that builds a solid foundation for your career.
By joining the College of Public Health, you gain the expertise required to design effective interventions, analyze critical data and break down access barriers in underserved communities. Explore tuition and financial aid options to see how accessible advancing your education can be.
If you are ready to make a lasting impact on population health, visit our admissions page or contact us for more details. Schedule an appointment with an admissions advisor today to take the next step in your career.
- Retrieved on 2026-06-12 from cdc.gov/nchs/products/databriefs/db548.htm
- Retrieved on 2026-06-12 from cdc.gov/nchs/nvss/life-expectancy.htm
- Retrieved on 2026-06-12 from healthsystemtracker.org/chart-collection/u-s-life-expectancy-compare-countries/
- Retrieved on 2026-06-12 from cdc.gov/nchs/data/nvsr/nvsr74/nvsr74-06.pdf
- Retrieved on 2026-06-12 from healthsystemtracker.org/chart-collection/what-drives-differences-in-life-expectancy-between-the-u-s-and-comparable-countries/
- Retrieved on 2026-06-12 from kff.org/racial-equity-and-health-policy/racial-disparities-in-life-expectancy/
- Retrieved on 2026-06-12 from pmc.ncbi.nlm.nih.gov/articles/PMC6345642/
- Retrieved on 2026-06-12 from pmc.ncbi.nlm.nih.gov/articles/PMC12692230/